
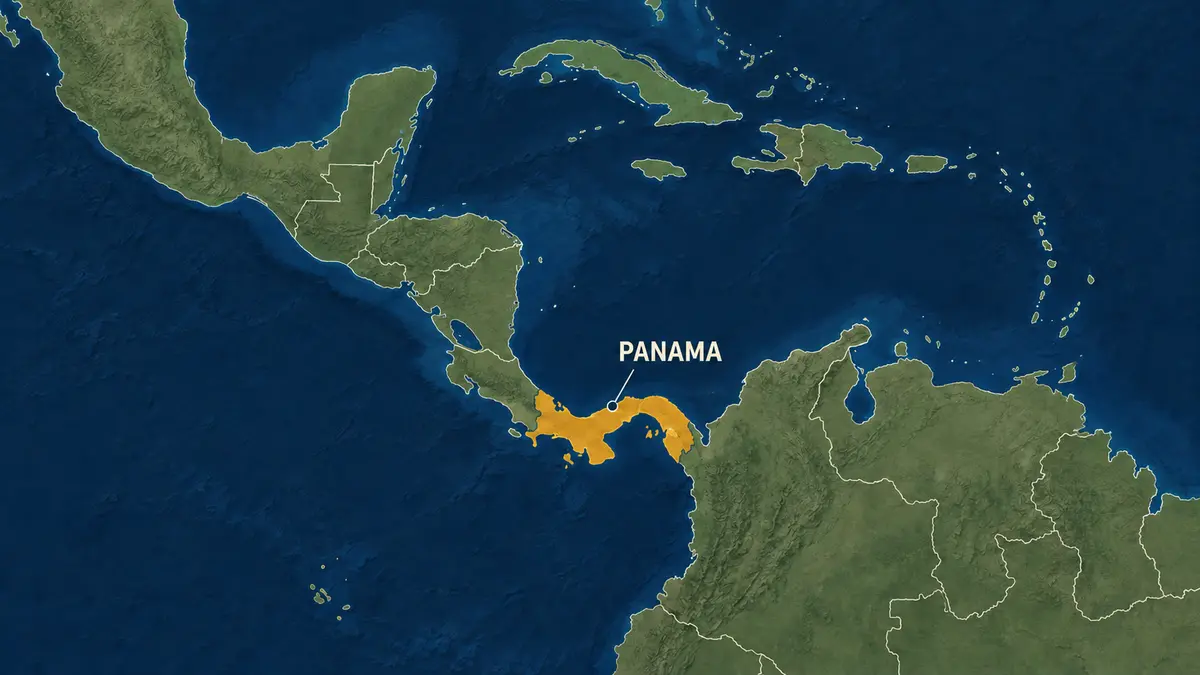
The canal in Panama reported net income of $3.45 billion for the fiscal year ending in September 2024, up 9.5%, despite drought-related traffic restrictions. Reuters reported the result on October 25. Operating costs fell 5%.
Two sides of an infrastructure shock
The financial result and the experience of a shipper answer different economic questions. The operator's accounts describe its own income and expenditure. They do not measure every cost borne by businesses trying to move goods through the route. As an editorial interpretation, stronger profitability is therefore not proof that a disruption left the wider supply chain unharmed.
A carrier's relevant calculation can include the price of passage, time committed to a journey and the consequences of missing a delivery window. A port customer's calculation may be different again. These are categories for assessing a disruption, not estimates of losses in this case. Establishing an actual burden would require route-specific evidence rather than subtracting an operator's profit from somebody else's expected revenue.
The traffic count has its own definition
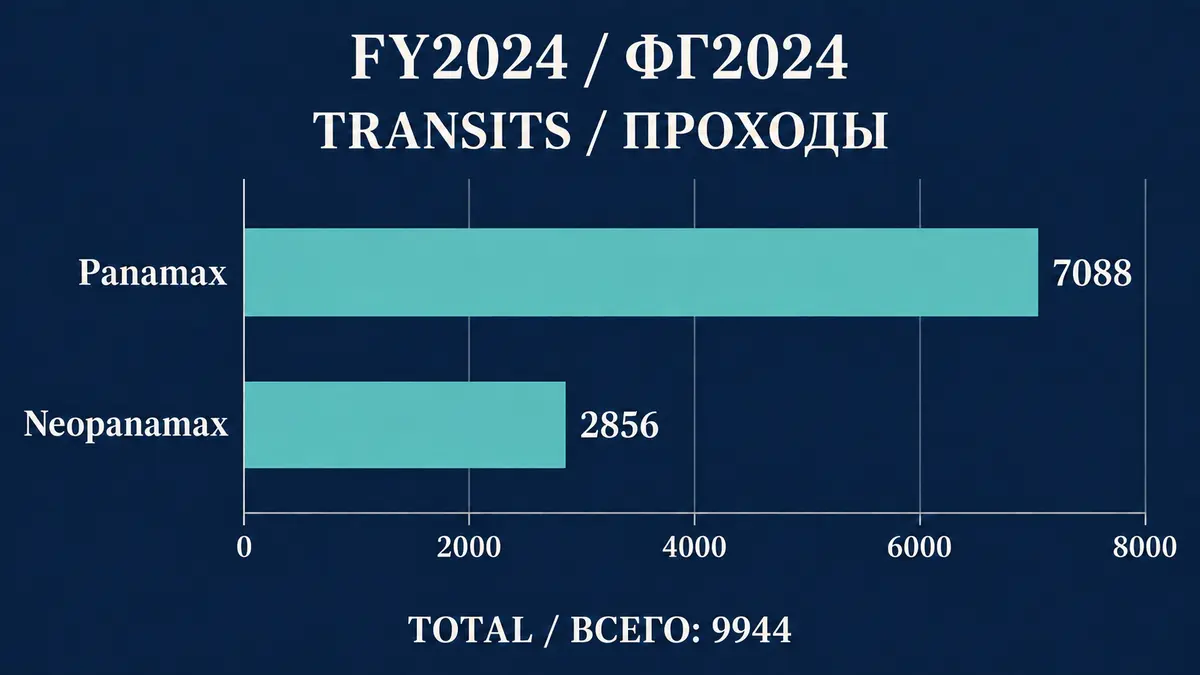
The canal authority's FY2024 results recorded 9,944 deep-draft transits: 7,088 Panamax and 2,856 Neopanamax. Those are the two counts displayed in the accompanying chart. They are passages, not a census of distinct ships or a measure of cargo weight.
Why a profitable route can still be constrained
In general economic terms, a capacity constraint and a positive financial return can coexist. Charging for a scarce service, changing the mix of services sold or reducing expenditure can protect a provider's result without removing the physical limit. None of those possibilities, taken alone, measures the availability of an additional passage on a particular date.
- Read financial performance separately from the number of services delivered.
- Keep the operator's costs separate from customers' transport and timing costs.
- Use passage counts for activity, not as a substitute for cargo capacity.
A useful assessment would join those perspectives without collapsing them into one score. Water availability concerns the physical system; accounts concern the organisation; delivery performance concerns the user. A satisfactory result in one category cannot establish the condition of the others. This is why an infrastructure report needs more than a profit headline to describe economic resilience.
The reporting period matters
This is a historical report about a completed fiscal period, not a statement of current booking conditions. The chart does not represent a forecast or a calendar-year total. Subsequent access conditions and the outcome of any later water-management investment require separate evidence; they cannot be inferred from these annual figures.