
On 2 September 2026, Reuters reported that Uber was reducing management layers and broadening managers' remits, according to the company. Its message to employees described the intended organisational changes. That announcement provides a setting for a separate question about reporting structures, not evidence of the results of the invented example below.
Keeping the people while changing the tree
A shallower organisation need not have fewer managers. It can also keep the same number of direct-report relationships. Those possibilities are easy to miss when the height of an organisation chart is treated as a count of the people maintaining it. A box can move closer to the top without disappearing, and the line joining it to its immediate manager can change without reducing the total number of lines.
The distinction matters when comparing two proposed structures. One proposal might remove positions. Another might keep every position but change who reports to whom. Calling both proposals a reduction in layers leaves a substantial difference unexplained. In the second case, the organisation needs to account for the redistribution of relationships, rather than silently attribute the shorter chart to a smaller management population.
Consider an entirely fictional organisation with twenty-one roles. Five roles have direct reports, including the role at the top. Sixteen have none. Every role other than the top role has exactly one immediate manager. These assumptions make a reporting tree: following the immediate-manager links from any role eventually reaches the same root, without a loop or a second parent. They do not describe every possible form of organisation.
The example retains all twenty-one roles, all five managerial roles and all sixteen terminal roles. It assumes no change in pay, title or decision authority. A changed reporting relationship might have additional significance in practice, but none is assigned here. The purpose is to establish what can change in the shape of this particular tree before adding assumptions about work or performance.
Two branches begin at the top
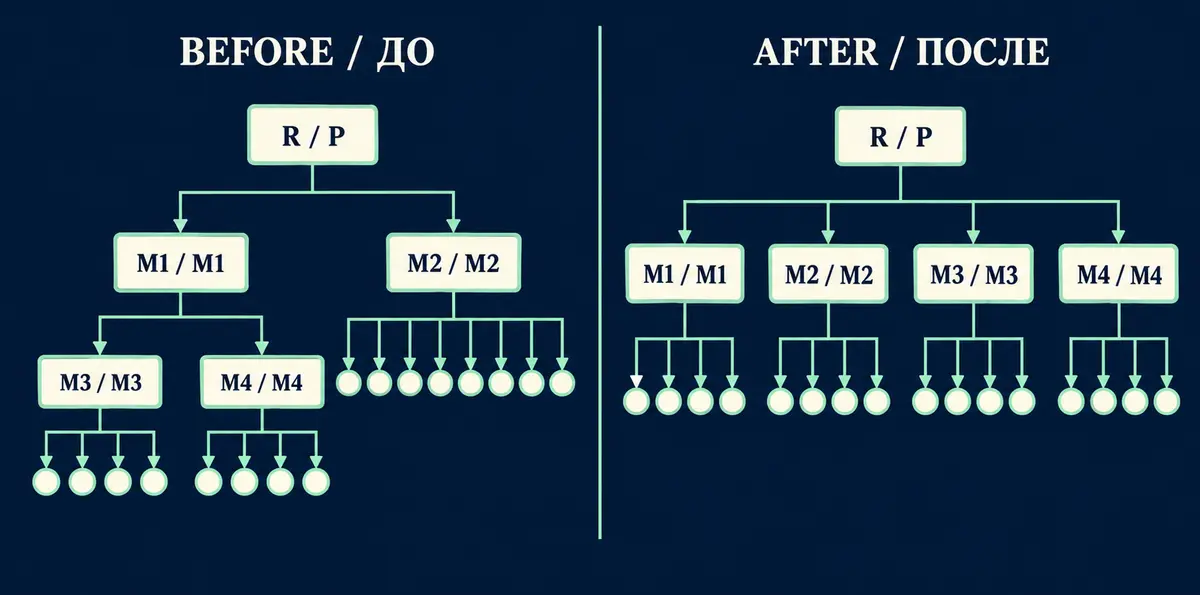
Call the top role R and the other four managerial roles M1, M2, M3 and M4. Initially, R has two direct reports: M1 and M2. M1 also has two direct reports, M3 and M4. M2 has eight terminal roles, labelled A1 through A8. M3 has four terminal roles, B1 through B4. M4 has another four, C1 through C4. The labels identify positions consistently; they do not rank the people occupying them.
This arrangement has two different shapes below the root. One branch reaches M2 and then its eight terminal roles. The other reaches M1, then M3 or M4, and only then the terminal roles below those managers. There are sixteen terminal roles in total, but they are not all at the same distance from the top. Counting them together should not erase that difference.
Define depth as the number of reporting links on the path from the root. R therefore has depth zero. M1 and M2 have depth one. Each A role has depth two. M3 and M4 also have depth two, while their B and C roles have depth three. Depth counts links, not job grades, minutes, messages or approvals. The longest path to a terminal role contains three links.
The initial direct reports
- R has M1 and M2: two direct reports.
- M1 has M3 and M4: two direct reports.
- M2 has A1 through A8: eight direct reports.
- M3 has B1 through B4: four direct reports.
- M4 has C1 through C4: four direct reports.
Adding those five counts gives twenty. That total includes managers reporting to other managers as well as terminal roles reporting to managers. It would be wrong to count only the sixteen terminal roles and describe the result as every direct-report relationship in the organisation. The four managerial roles below R each have an immediate manager too, and their four incoming relationships belong in the total.
Six relationships move, and every role remains
Now change the immediate manager of M3 and M4 from M1 to R. R has four direct reports rather than two. M3 still has B1 through B4, and M4 still has C1 through C4. Moving these two managerial roles does not itself reassign their terminal roles to R. It changes where their intact branches attach to the rest of the tree.
A second change gives M1 four terminal roles previously under M2: A5, A6, A7 and A8. M2 keeps A1, A2, A3 and A4. M1 therefore remains a managerial role, rather than becoming an empty box or disappearing. All four managers below R now have four terminal roles apiece. R has those four managers as its direct reports, so each of the five managers has a span of four.
The restructuring replaces six immediate-manager relationships. Two replacements concern M3 and M4. Four concern A5 through A8. Six old lines disappear and six new lines appear. The roles at their ends are retained. This is a change in the reporting structure, not merely a different arrangement of unchanged boxes on a page, and not a removal of six positions.
Looking at M1 makes the replacement particularly clear. Its relationship to its own immediate manager, R, does not change. Below M1, two relationships end and four begin, so the net increase in its direct reports is two. Looking at M3 separates the two ends of a managerial role differently: its incoming relationship changes from M1 to R, while all four outgoing relationships remain. A manager can therefore acquire a different place in the hierarchy without acquiring a different group of immediate subordinates. The six changed relationships need to be counted individually, rather than once for every role they touch.
It is also not an addition of six reporting relationships to the old structure. Keeping the previous parent lines alongside the new ones would give some roles more than one immediate manager and produce a different model. Here the new relationship replaces the old one in each of the six cases. Every non-root role continues to have exactly one immediate manager after the change.
The resulting tree has R at depth zero, M1 through M4 at depth one, and all sixteen terminal roles at depth two. Its maximum terminal depth has fallen from three to two. Yet there are still twenty-one roles, including five with direct reports. This is a concrete case in which a shallower formal organisation retains every managerial role rather than obtaining its shorter paths by deleting managers.
The same twenty lines are distributed differently
The unchanged total number of lines follows directly from the model. Apart from R, each of the twenty remaining roles has one immediate manager. Count the incoming relationship once for each of those roles and the result is twenty. The count does not depend on whether a particular role is close to the root or several links below it. Both layouts satisfy the same rule.
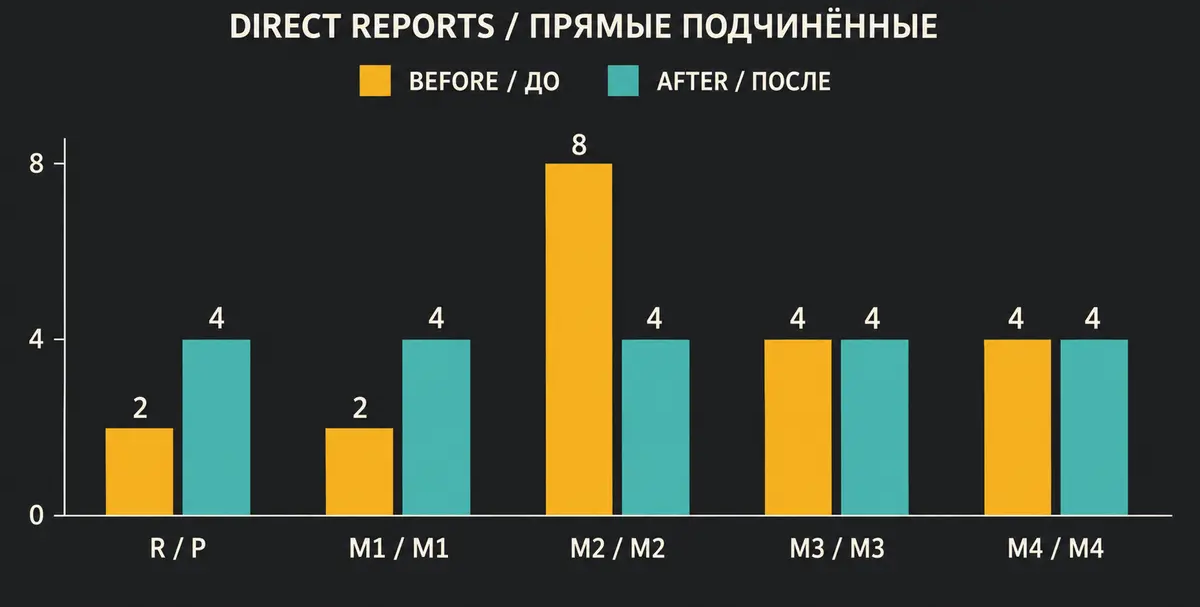
Alternatively, count the direct reports of each manager. Initially the five spans are two, two, eight, four and four. Afterwards they are four, four, four, four and four. Both lists sum to twenty because every relationship has been counted once at its managerial end. Dividing either total by the same five managers gives an average span of four.
That average has not prevented substantial local changes. R's span rises from two to four. M1's also rises from two to four, although its direct reports change from managerial to terminal roles. M2's falls from eight to four. M3 and M4 retain spans of four. An unchanged average therefore does not mean that each managerial role has an unchanged set, number or type of direct reports.
The maximum span falls as well, from eight to four. This is important because a vague description of flattening might suggest that the largest span must increase somewhere in the organisation. It does not in this example. The root takes more direct reports, but the previously largest span shrinks. A statement about one particular manager and a statement about the maximum across all managers answer different questions.
None of these counts establishes how demanding the relationships are. Four direct reports who are themselves managers are not assigned the same work as four terminal roles merely because the number is equal. The model does not supply such weights. It establishes the distribution of formal relationships precisely so that a count is not mistaken for an assessment of managerial effort.
A shorter path can leave the immediate manager unchanged
The B and C roles provide one useful way to see the difference between local and whole-tree information. Each B role still reports directly to M3. Each C role still reports directly to M4. The endpoints of all eight local reporting relationships remain the same. Nevertheless, each terminal role in these two groups is now one reporting link closer to R, because M3 and M4 moved upward in the tree.
For a B role, the old path was R, M1, M3 and then that B role. The new path is R, M3 and that same role. The corresponding C path loses M1 in the same way. Saying that the immediate manager is unchanged is accurate, but it is not a complete description of the role's location within the organisation. The structure above that manager has changed.
The A roles reveal the converse. A5 through A8 acquire M1 as their immediate manager instead of M2. Their old paths were R, M2 and the relevant A role; their new paths are R, M1 and that role. Both contain two links. These four roles therefore change immediate manager without changing depth. A1 through A4 keep both their manager and their depth.
This distinction makes two kinds of comparison useful for different purposes. A list of immediate-manager changes identifies the six reassigned roles. A list of terminal-depth changes identifies the eight B and C roles. These are not the same list, nor should they be forced to match. One records which local attachments changed; the other records a consequence that can extend through an unchanged branch.
The distance calculation describes the chart
Initially eight terminal roles have depth two and eight have depth three. Their total depth is eight times two plus eight times three, or forty links counted across sixteen separate root-to-terminal paths. Afterwards all sixteen have depth two, giving a total of thirty-two. Dividing by sixteen gives an average terminal depth of two and a half before the change and two afterwards.
These totals do not contradict the twenty reporting relationships in either tree. The path calculation counts a shared relationship again each time it lies on a different terminal role's path. For example, the old link from R to M1 occurs on the paths to all eight B and C roles. The total path length and the number of distinct edges are different measurements, so they need not coincide.
Nor do the eight links removed from the sum of path lengths mean that eight actual messages or approvals have been avoided. The example has not defined a requirement for each terminal role to send anything to R. It has not stated which decisions are made locally or whether communication follows the formal hierarchy. Turning graph distance into a frequency or a duration would require additional information that is absent here.
The average depth is useful within its stated scope: it summarises where these sixteen terminal roles sit relative to this root. It does not describe the average depth of all twenty-one roles, because the five managerial roles are not in its denominator. Keeping the population explicit prevents a change in the meaning of the measure while comparing the two layouts.
The picture leaves the work unspecified
An organisation chart can locate a formal relationship without explaining the work passing through it. A manager may provide supervision, coaching, planning or a combination of duties, but this model assigns none of those activities a quantity. It also leaves the authority of each position unchanged as an unspecified feature. A shorter line of ancestry is therefore not presented as a transfer of permission to make a decision.
The same restraint applies to titles and status. Moving M3 or M4 closer to R could be interpreted in several ways in a real organisation. The example neither calls the move a promotion nor rules that interpretation out. It says only which immediate manager each role has in the two trees. No pay change, title change or alteration in authority follows from the labels supplied.
Finally, the formal tree is not a map of everyone who talks to everyone else. The people represented by its terminal roles might cooperate across branches, or use arrangements that the model does not specify. Adding imagined communication lines would answer a different question. The twenty counted relationships are precisely the immediate-manager links defined at the start, not every working connection inside the organisation.
What the shorter hierarchy actually preserves
The result is a redistribution with several simultaneous features. Maximum terminal depth falls, average terminal depth falls, and the root's span rises. At the same time, the largest span falls, the average managerial span remains four, and no managerial role disappears. These statements can all be true together because they describe different properties of the same two reporting trees.
A comparison based only on the average span would miss the rearrangement. A comparison based only on maximum depth could suggest a smaller management population that is not present. Following the identities and immediate-manager links shows exactly what happened: six relationships were replaced, sixteen terminal roles remained, and the twenty distinct edges were redistributed among the same five managers. The organisation became shallower without becoming smaller.