
A business that knows its annual vehicle repair bill does not necessarily know how much of that bill an insurance arrangement would leave on its own account. The missing information can be the pattern of events behind the total. One substantial incident and several smaller incidents can produce the same damage but a different division between the business and its insurer. A deductible applied separately to each eligible event makes that distinction visible.
In its April 18, 2024 report on motor insurance in Russia, Kommersant discussed deductibles as a means of lowering an upfront premium while retaining part of a loss. It described several arrangements, not one universal policy. That provides a starting point for examining the repeated layer of cost a buyer may retain.
The useful question for a small fleet is not simply whether its premium becomes cheaper. It is what happens to its own expenditure under different loss patterns. The exercise below uses invented units and deliberately simple terms. Its events are already classified and eligible. It is an explanation of allocation, not advice about choosing a policy, classifying an accident or submitting a claim.
Define the retained layer before adding the losses
Imagine a fictional business with a motor policy that leaves the first ten accounting units of every eligible event with the business. The deductible starts again for each event. There is no annual cap on this retained amount, no other payment limit and no exception in the example. The numbers are not currency amounts or a quote from an insurer. This per-event rule is an explicit assumption, not a statement that every deductible works this way.
Ingosstrakh's rules approved in April 2022, articles 32–33, distinguish conditional and unconditional deductibles, place their type and size in the policy and permit other arrangements. Those historical rules are not evidence of the terms of a current quotation. Our fixed per-event assumption is narrower than that range.
Within the exercise, an eligible loss smaller than ten stays entirely with the business. A larger loss leaves ten with the business and the excess with the insurer. In symbols, the retained amount is the smaller of the loss and ten. The payment is the larger of the loss minus ten and zero. The two amounts always add back to the eligible loss in this model.
Three paths to exactly the same damage
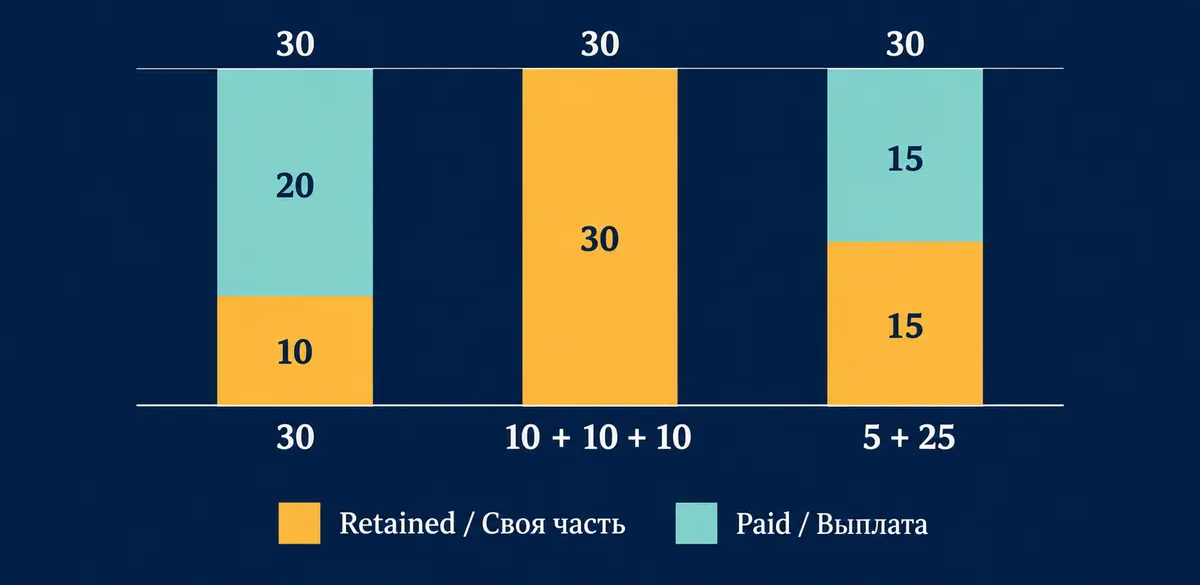
Start with a year containing one eligible event costing thirty units. The business retains ten and the insurer pays twenty. Nothing about that split reduces the thirty units of damage. It identifies who bears the expense under the assumed arrangement. Before any premium is considered, the business's retained loss is one third of the total in this particular scenario.
Now replace that year with three distinct eligible events, each costing ten. Apply the rule to each event before adding the results. The business retains ten three times, for a total of thirty. The insurer pays zero for each event. Annual damage is still thirty, but the business now bears all of it. The change comes from repeated application of the same first-loss layer, not from a change in price or a failure to honour the assumed terms.
The mixed case catches another shortcut
A third year contains two eligible events costing five and twenty-five. The first leaves five with the business and nothing with the insurer. The second leaves ten with the business and fifteen with the insurer. Total retained loss is therefore fifteen, and total payment is fifteen. Once again, damage adds to thirty. This middle case shows why multiplying the number of events by the deductible can also be wrong.
Two events do not automatically produce twenty units of retained loss: one event is too small to use the whole ten-unit layer. The correct sequence is to calculate the allocation for each event and then sum it. A yearly damage total loses the event structure; a bare event count loses the individual sizes. Neither number alone reproduces all three results.
An annual allowance would be a different arrangement
It is tempting to subtract ten from the annual total of thirty and record a twenty-unit payment in every scenario. That calculation would apply a single annual retained layer, not the repeated per-event rule stipulated here. The arithmetic is straightforward, but it answers a different question. A spreadsheet can be internally consistent and still represent the wrong arrangement.
The distinction also explains why the deductible should not be described casually as the buyer's maximum yearly exposure. Under this example, it is the maximum retained amount from one eligible event before other assumptions are considered. Several events can repeat it. Smaller events may use only part of it. An annual maximum would require an additional term that the model does not contain.
This is not a ranking of annual and per-event structures. They distribute losses differently and would need their own terms and prices for a meaningful comparison. For the present purpose, keeping the structure fixed is enough. The question is whether the budget uses the same unit of application as the arrangement it is trying to represent.

A loss register needs more than invoice totals
For the fictional fleet, a useful analytical record would keep an event identifier alongside the eligible amount. That allows the calculation to preserve the grouping already established in the scenario. It does not mean that the business can decide to merge or divide incidents to obtain a better payment. Event classification is an input here, not a decision variable or a suggestion about claims handling.
An invoice and an event are not necessarily the same unit of observation. One assumed event might generate several repair invoices in the exercise, while a consolidated payment record might cover work associated with different events. Applying the deductible to invoice rows without checking what those rows represent could repeat or omit the retained layer. The resulting error would be a data-structure error before it became an arithmetic error.
A compact working register could therefore contain:
- The established event identifier and its eligible loss amount.
- The assumed deductible rule and the amount retained for that event.
- The corresponding model payment, kept separate from any actual receipt.
- A reconciliation showing that retained amount plus payment equals the eligible loss.
- A clear distinction between event records, invoices and the annual summary.
The register's purpose is to make the calculation reproducible. Another reader should be able to follow each event into the yearly total and identify where the rule was applied. More columns do not automatically improve the result; the crucial feature is retaining the information that the allocation function actually needs.
Suppose the twenty-five-unit event appears in two invoice rows of twelve and thirteen. If the ten-unit layer were wrongly applied twice, the spreadsheet would record twenty retained and five paid. Applying it once to the established event correctly records ten retained and fifteen paid. Total damage remains twenty-five in both calculations, so checking only the grand total would not expose the error. The reconciliation must test grouping as well as addition.
Conversely, putting three distinct ten-unit events into a single thirty-unit row would produce the one-event allocation if the formula were applied only once. That would understate retention by twenty in this exercise. Neither error requires anyone to mistype a number. Both arise because a reporting row has silently replaced the event as the unit of calculation. Preserving identifiers is therefore part of the economic model, not merely an administrative preference.
A premium saving and a retained loss belong in different columns
Add a second fictional layer. Assume an otherwise identical policy without a deductible costs twelve units, while the policy with the ten-unit per-event deductible costs six. These are invented premiums, not market estimates. In the zero-deductible alternative, all the eligible damage in these scenarios is paid under the stated assumptions. No other differences between the alternatives are introduced.
In a year with no eligible events, the buyer spends twelve under the first alternative and six under the second. The six-unit premium difference is real within that assumed scenario. In the one-event year with thirty of damage, however, the deductible alternative produces total buyer expense of sixteen: six of premium plus ten retained. The zero-deductible alternative still costs twelve in this simplified comparison.
For three ten-unit events, the deductible alternative costs thirty-six: six plus thirty. For the five-and-twenty-five pattern, it costs twenty-one: six plus fifteen. The figures are conditional realised costs, not expected annual costs. No probability has been assigned to any path. Listing several scenarios does not make them equally likely, and averaging them without an explicit probability model would create an unsupported forecast.
The arithmetic makes one point: a known premium difference cannot be treated as a known difference in total expenditure before the loss path is specified. It does not establish a universally preferable product. That would require information about probabilities, preferences, available terms and other considerations absent from the exercise.
Prevention can change who receives the financial benefit
The event-level view also reveals how a reduction in eligible damage affects the allocation. Keep the same assumed deductible and reduce the single thirty-unit event to twenty. Damage falls by ten. The business still retains ten, while the model payment falls from twenty to ten. In that particular comparison, the direct reduction in the insured repair amount changes the insurer's allocation rather than the business's retained layer.
Now reduce a ten-unit event to five. The model payment is zero in either case, while the retained amount falls from ten to five. The business receives the entire five-unit reduction in retained repair expense. These examples do not say that prevention is pointless above the threshold or valuable only below it. They isolate one component of the benefit under the assumed payment rule.
Downtime, injury, disruption and future pricing are outside the numerical model, as are the costs of preventive action. It would therefore be wrong to infer a return on a safety investment from these repair allocations alone. The narrower insight is that a reduction in total damage and a reduction in the buyer's retained repair cost need not be the same amount.
Eliminating a separate ten-unit event entirely removes that whole retained layer. This differs from reducing a large event by the same ten units. Equal reductions in total repair expense can therefore affect the buyer differently depending on where they occur in the loss pattern. An overall percentage improvement needs that additional detail before its effect on retention can be calculated.
Frequency and severity must remain separate inputs
A fleet could have the same annual damage in two years yet very different exposure to repeated first-loss layers. This is why a forecast built only from last year's aggregate repair expenditure cannot reproduce the deductible calculation. The amount is relevant, but the distribution across eligible events is also part of the input. Removing that distribution discards information needed for the result.
Nor does a lower average event size automatically imply a lower retained total. In our three-event path, the average loss is ten rather than thirty, but total retention is higher. Both event count and event size changed. Treating the lower average as evidence of a smaller retained burden would confuse a characteristic of individual events with the sum borne across the year.
Even count and average together need not replace individual sizes. Two events totalling thirty have an average of fifteen. But fifteen plus fifteen leaves twenty with the business, while five plus twenty-five leaves fifteen. Count, damage and average are identical; the positions relative to the threshold differ. A transparent set of scenarios can expose that sensitivity without becoming a probability model. Expected costs would require separately justified probabilities, not weights assigned merely because a table is convenient.
A sound scenario discussion names what changes and what stays fixed. Here, total damage is held at thirty while the grouping changes. In the prevention examples, the grouping is fixed while one event's severity changes. Keeping those experiments separate prevents a conclusion about one relationship from being accidentally attributed to another.
Use the result to describe a budget, not to predict a policy outcome
The fictional budget has two distinct components: a known assumed premium and a retained-loss amount that depends on the scenario. Describing them separately makes the source of variation visible. It also prevents a payment estimate from being mistaken for money already received. The calculation addresses allocation; it does not include the administrative process or timing of settlement.
For a real comparison, the relevant contract would determine eligibility, grouping, exceptions and limits. Those inputs cannot be supplied by the premium figure or by a general definition of a deductible. The historical source demonstrates that arrangements vary; the fictional calculation demonstrates why a particular per-event rule needs event-level information. Neither replaces the other.
The durable conclusion is precise. Under a deductible renewed for each eligible event, the same annual damage can leave different amounts with the buyer. Calculate the first-loss layer at the level where it applies, preserve the pattern of events and only then add the totals. That sequence turns a repair bill into an allocation the budget can explain, without pretending that an inexpensive premium has removed the underlying damage.