
A percentage change in profit appears to be a compact fact. It has a current number, an earlier number and a calculation connecting them. Yet the most consequential choice can be hidden inside the earlier number. If that comparison includes an unusual gain while the current period does not, the resulting decline answers a different question from a comparison that excludes the gain. Both calculations can be correct. Presenting either without its definition can still mislead.
This is more than a dispute over a footnote. A headline can travel through a board presentation, a supplier discussion or a market summary long after the qualification has disappeared. Readers then argue about the direction or severity of a change while using different starting points. Before interpreting the percentage, it is worth reconstructing the two numbers that produced it.
Reporting on WineLab in Russia, PRIME on 24 August 2026 described first-half profit of 790 million roubles and a decline of 42.9%. Crucially, the comparison excluded a one-off financial gain from the first half of 2025. The qualification belongs with the percentage: it is not an optional detail that can be removed when shortening the result.
The question explored here is how to read that kind of comparison, not whether an adjusted result should replace the reported one. The public news item supplies a narrow factual starting point. The arithmetic examples below are entirely fictional and do not reconstruct WineLab's statements, taxes, cash movements or valuation. They show why consistent definitions matter even when everyone agrees on the current-period figure.
Identify what the starting point contains
A year-on-year percentage is a ratio, not an explanation. Subtracting one from current profit divided by earlier profit tells the reader how two selected amounts relate. It does not explain why they differ, whether the difference will persist or which number is most useful for another decision. Those interpretations require information beyond the division itself.
The starting amount can contain several economically different items. Some may arise from ordinary activity; others may be identified separately because of a particular transaction or circumstance. An analytical adjustment changes the scope of the amount being compared. It should therefore be described as a defined view of the result, not as a discovery that the reported number never existed.
The same discipline applies to a favourable change. Removing an earlier gain can make a current decline appear smaller or current growth appear stronger. Removing an earlier expense can move the comparison in the opposite direction. A method should not depend on which version produces the more attractive headline. The reason for the adjustment must be stated before its effect is celebrated or criticised.
A previous statement is context, not an independent audit
A prior release posted by the NovabevGroup corporate account presented WineLab's first-half 2025 profit both including and excluding a one-off gain. That attributed company statement helps explain why two comparative bases exist. It is not independent verification of the underlying accounts, and this article does not claim to have audited or reconstructed them.
Keeping the provenance visible is part of keeping the numbers visible. A company's explanation can be relevant without being treated as an outside assurance. An agency report and a corporate statement also have different roles: one reports the announcement, while the other expresses the issuer's presentation. Neither role authorises the reader to fill gaps with an assumed accounting treatment.
One current result, two explicitly labelled comparisons
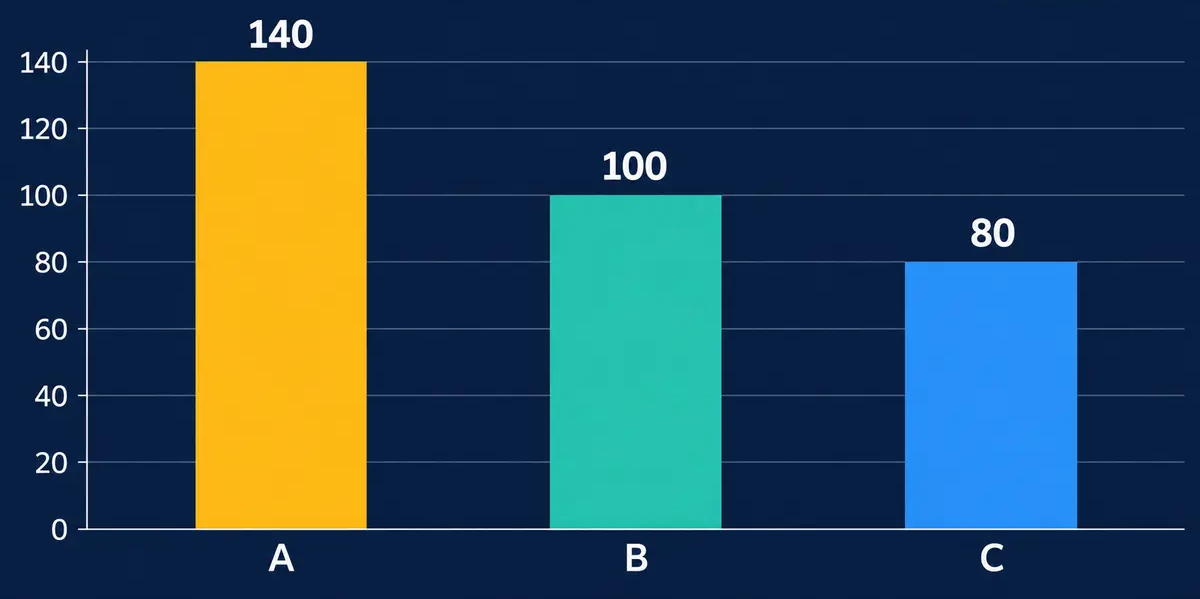
Consider an invented business using abstract monetary units. In the earlier period it earns a contribution of 100 and records a separately identified gain of 40. For this model only, define the reported total as their sum: 140. In the current period, the contribution falls to 80 and there is no separate gain. The reported current total is therefore 80.
A reported-to-reported comparison divides 80 by 140 and subtracts one. The decline is approximately 42.86%. A comparison excluding the earlier gain divides 80 by 100 and subtracts one. The decline is 20%. The current amount has not changed. What changed was the earlier denominator and the economic scope assigned to it.
In the accompanying fictional chart, A marks the earlier reported total of 140, B the earlier adjusted base of 100, and C the current total of 80. The vertical scale uses the model's abstract units, not a company's reported currency amounts.
It would be wrong to say that one calculation disproves the other. The first shows the movement between the two defined totals. The second isolates the movement between the contributions after applying the model's exclusion. Each answers a different question. The error begins when a writer labels both simply “profit growth” and leaves readers to assume that the measures are identical.
The bridge is also straightforward in absolute terms. The reported amount decreases by 60, from 140 to 80. In this deliberately simple model, 40 of that difference comes from the absence of the earlier gain and 20 from the lower contribution. This is an arithmetic decomposition under stated assumptions, not a claim that the two effects have the same cause or managerial significance.
No tax adjustment, accounting-standard classification or actual company expense is embedded in these numbers. The word “contribution” is simply a label inside the illustration. Real published measures need their own definitions and reconciliations. The purpose of the example is to make the denominator visible, not to provide a substitute set of financial statements.
Absolute differences help explain percentages
The two rates can sound dramatically different when read alone. Showing the underlying amounts reveals why they differ without requiring a debate about tone. An earlier total of 140 and an earlier adjusted amount of 100 are not the same starting point. Repeating that fact beside the percentage is often more useful than adding another adjective about the size of the decline.
Absolute changes and percentages should remain distinct. A reduction of 20 units from 100 is 20%. A reduction of 20 units from 200 is 10%. The amount lost is the same, but its proportion of the starting base differs. This elementary relationship is precisely why dropping the definition of that base changes the meaning of the comparison.
This presentation also lets the reader check each step separately. There is no need to guess whether a discrepancy comes from a new current figure, a different prior figure or additional rounding. A transparent sequence reduces hidden assumptions and makes the discussion more useful, even when the conclusion about the direction of change remains unchanged.
Apply the same rule to both periods
Now extend the fictional example. Keep the earlier contribution of 100 and gain of 40, but give the current period a contribution of 80 and a separate gain of 10. The reported current total becomes 90. Comparing reported totals gives 90 divided by 140 minus one, or a decline of approximately 35.71%.
If the analytical rule excludes both separately identified gains, the comparable amounts remain 80 and 100. The adjusted comparison still shows a 20% decline. Comparing the current reported total of 90 with the earlier adjusted amount of 100 would instead show a 10% decline. That last calculation mixes definitions unless the writer provides a specific reason for doing so and labels it accordingly.
Consistency does not mean that every item must always be excluded. It means that the stated selection principle is applied coherently. If two items differ in a way that matters to the analysis, explain that difference. If the available disclosure is insufficient to decide, preserve the uncertainty rather than silently treating one period more generously than the other.
A useful reconciliation therefore lists what was removed, from which period, and why. It also shows the effect on the final amount. Readers can then retain the reported figures while assessing the usefulness of the adjusted view. Without that bridge, “adjusted” risks becoming a label whose contents change whenever the comparison becomes uncomfortable.
Do not turn an adjustment into a second transaction
An analytical exclusion changes a presentation. It does not reverse the historical event. In the first fictional example, removing the gain of 40 from the comparison does not mean that 40 was returned, lost or never recognised. It means that a selected analytical view is being shown alongside the total. Conflating the two creates a different kind of error.
Nor does an exclusion establish whether the underlying event involved cash. Cash timing, accounting recognition and the definition of a comparative earnings measure are separate questions. This article's model deliberately says nothing about cash. A reader who needs that answer must consult the appropriate disclosure instead of deducing it from the adjective attached to a profit measure.

One-off is a classification to examine
Calling an item one-off does not prove that an economically similar item can never occur again. It identifies how the item is being described in the presentation under review. A reader may reasonably ask whether the exclusion relates to a unique transaction, an unusual amount or a category that appears in different forms across several periods.
Those questions should be asked without assuming bad faith. A business can encounter genuinely unusual events, and a separate analytical view can make its continuing activity easier to understand. The discipline is to keep the reasoning and the historical totals available. A useful adjustment adds a perspective; it does not erase inconvenient history.
Repeated exclusions deserve particular care because individually unusual events may collectively form a recurring feature of a business. That possibility does not tell the reader what to do with every item. It suggests examining a longer record before assuming that the adjusted view describes a permanently cleaner future. The appropriate conclusion may be a range of interpretations rather than a single preferred number.
The reverse problem also exists. Refusing to consider any adjustment can obscure a meaningful change in continuing activity. A large prior gain can dominate the percentage even when the remaining business moved much less. Keeping both views is more informative than declaring one universally legitimate and the other universally misleading.
Keep the perimeter fixed as well as the arithmetic
Even a perfectly explained exclusion does not make every pair of numbers comparable. The legal entity, business perimeter, reporting period, currency and metric must also match the question. A retail subsidiary's result cannot simply be replaced with its parent's total because the names appear together in the same announcement.
The same caution applies to profit measures at different levels. Operating profit, a company's defined earnings indicator and net profit are not interchangeable labels. A percentage calculated from one should not inherit the name of another during editing. The shortest version of a result still needs enough definition to identify the amount being discussed.
Rounding creates another practical boundary. A release may display amounts rounded to tenths of a billion while calculating a percentage from more precise figures. Recalculating the percentage from the rounded display can produce a slightly different result. That does not automatically establish an error. It means the precision of the inputs should be checked before asserting a contradiction.
For the same reason, this discussion does not derive a supposedly exact alternative WineLab decline from rounded prior figures. The fictional model uses deliberately exact inputs, so its rates can be reproduced. The real news anchor retains the agency's stated qualification. Keeping those two levels separate avoids giving an illustrative calculation the authority of an unseen underlying table.
Nor should the explanation be extended beyond its task. A consistent comparative base helps interpret a measure's movement, but does not automatically answer questions about future demand, financing resilience or a share's appropriate price. Each needs its own evidence. A well-executed check of one ratio is not a universal conclusion about the entire business.
A compact review before a percentage is reused
A useful review can be short without being superficial. Before a profit comparison enters a presentation or summary, record the following information alongside it:
- The precise entity and reporting period on each side of the comparison.
- The name and definition of the earnings measure being compared.
- The reported amounts before any analytical exclusions.
- The items removed from each period and the stated reason for removal.
- The reconciliation between reported and adjusted amounts.
- The source and precision of the numbers used to calculate the percentage.
This is not a demand that every headline reproduce a financial report. It is a way to preserve the minimum information needed for the headline to retain its meaning. A short phrase such as “against the adjusted prior-period base” can prevent a lengthy later misunderstanding, provided the full explanation is available nearby.
The review also separates a mathematical question from an evaluative one. The mathematics asks whether the ratio follows from the stated inputs. Evaluation asks whether those inputs are useful for the decision at hand. Correct division does not settle the second question, and disagreement about an adjustment does not necessarily mean the division is wrong.
Preserve the comparison rather than choose a winner
The most useful outcome is not a competition in which either the reported or adjusted figure wins. It is a presentation in which readers can see the relationship between them. The reported total preserves the historical scope of the result. A clearly reconciled adjustment offers another view, with its exclusions and limitations attached.
In the fictional examples, the business can show both a substantial reported decline and a smaller decline in the selected contribution. Those statements coexist because their bases differ. Recognising that difference neither excuses weaker performance nor exaggerates it. It allows the discussion to move from competing percentages to the components that actually changed.
That is the practical lesson of a qualified earnings headline. Read the starting point before judging the rate. Keep the qualification when repeating the number. Treat corporate explanations as attributed statements and illustrative arithmetic as illustration. A comparison becomes more informative when its boundaries remain visible, even if that makes the summary a few words longer.